East Asian cities
Four cities a short flight apart, each with a different year. 4 stops, 3,464 km end to end as the crow flies.
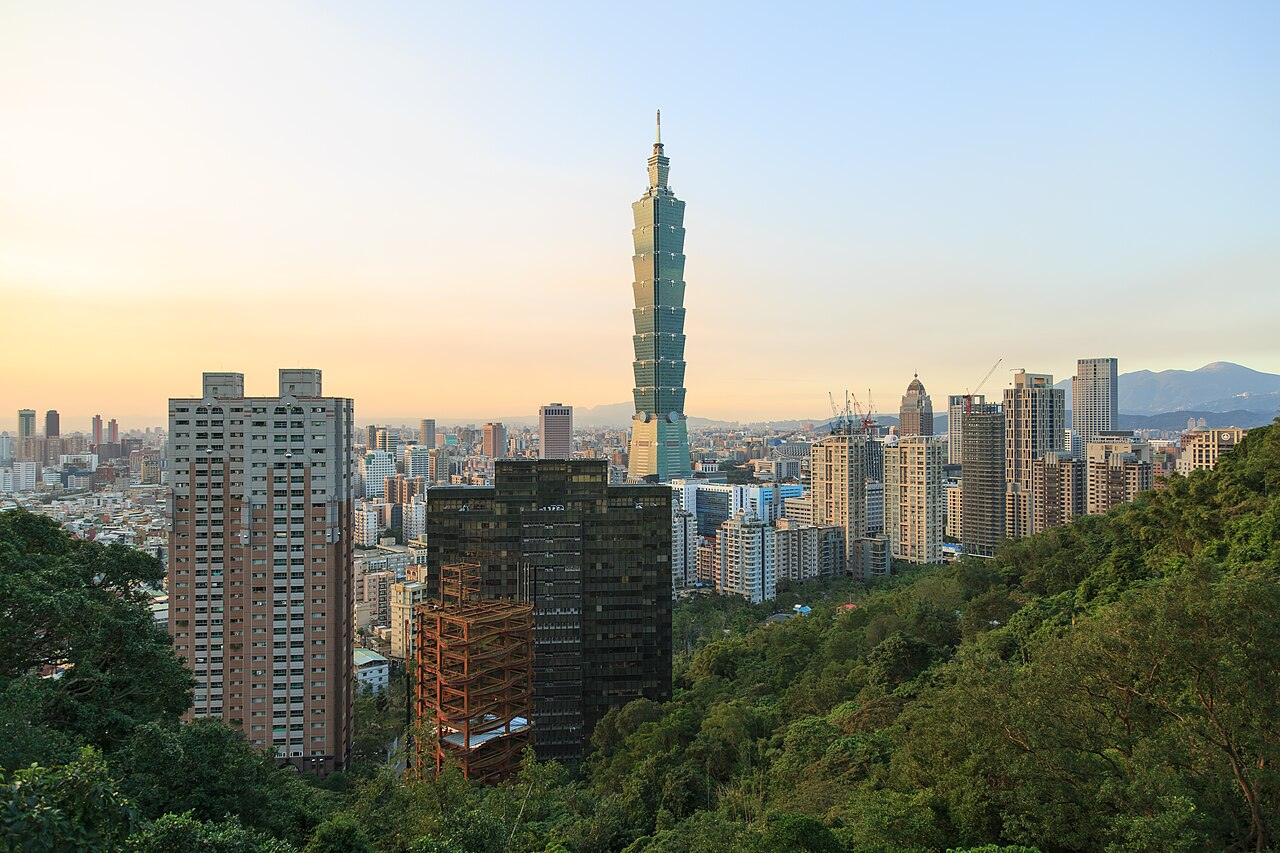
The stops, in order
-
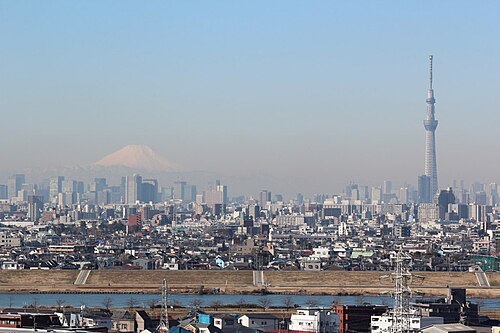 Tokyo
Japan · best Apr, Aug, Oct
Tokyo
Japan · best Apr, Aug, Oct
-
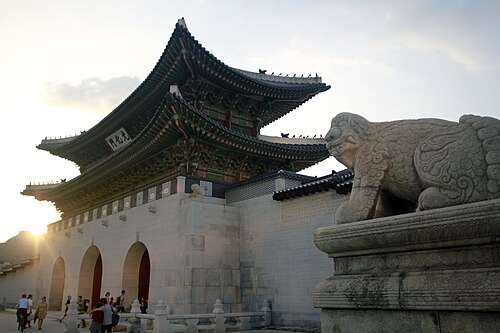 Seoul
South Korea · best Apr, May, Jun
Seoul
South Korea · best Apr, May, Jun
-
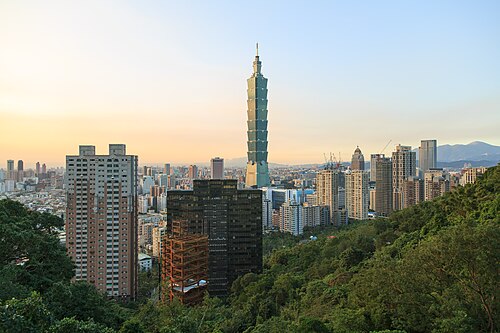 Taipei
Taiwan · best Feb, Mar, May
Taipei
Taiwan · best Feb, Mar, May
-
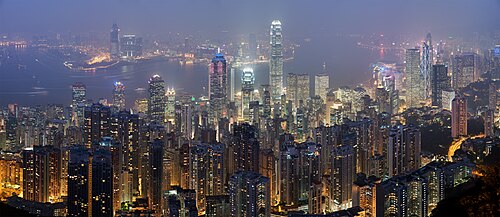 Hong Kong
 · best Jan, Feb, Dec
Hong Kong
Hong Kong · best Jan, Feb, Dec
Month by month
| Place | Jan | Feb | Mar | Apr | May | Jun | Jul | Aug | Sep | Oct | Nov | Dec |
|---|---|---|---|---|---|---|---|---|---|---|---|---|
| Tokyo | 9° | 10° | 14° | 18° | 22° | 25° | 29° | 31° | 27° | 21° | 16° | 11° |
| Seoul | 2° | 4° | 9° | 14° | 18° | 23° | 27° | 28° | 25° | 19° | 12° | 4° |
| Taipei | 19° | 20° | 23° | 26° | 29° | 31° | 33° | 32° | 31° | 27° | 25° | 20° |
| Hong Kong | 20° | 21° | 24° | 27° | 29° | 30° | 31° | 31° | 30° | 28° | 25° | 21° |
| Sweet spots | 2 | 3 | 1 | 2 | 3 | 1 | 1 | 1 | 0 | 1 | 0 | 1 |
Each cell is that destination's own verdict for the month — sweet spot, ok or avoid — with its typical daily high, from the same ten years of climate readings its page is built from. A dot marks a busy month. The last row counts the sweet spots, and the best months are marked.
Between the stops
| Tokyo → Seoul | 1,194 km, about 2h 22m in the air Nonstop, about 3 a day · 3 airlines By road: 1,723 km, about 26h 25m |
|---|---|
| Seoul → Taipei | 1,464 km, about 2h 42m in the air Nonstop, about 14 a day · 9 airlines |
| Taipei → Hong Kong | 806 km, about 1h 54m in the air Nonstop, about 40 a day · 8 airlines |
Distances are great-circle and the flight time is estimated from them. A road, train or bus line is listed only where it was measured — flights from AeroDataBox, roads from OpenRouteService, trains and buses from public timetables via Transitous — and none of it is a fare; the searches on each stop's page are where prices live.
Every verdict here is the destination's own: ten years of climate readings, the public holidays that crowd it, and what the flight costs. Nothing is said about East Asian cities as a whole that was not first measured at each place in it.